


Table of contents
- Introduction
- Audience
- Prerequisites
- Architecture
- RED Metrics
- Step 1 - Setup a .Net 6 WebAPI Project
- Step 2 - Create a Metrics Definitions Class
- The distribution of observations : request_duration_seconds_bucket
- The frequency of observations : request_duration_seconds_count
- The sum of observations : request_duration_seconds_sum
- Step 3 - Implement the Metrics Middleware
- Step 4- Register Metrics Reporter and Middleware
- Step 5 - Add a Custom "Problem" Method
- Step 6 - Add a Long-Running Method
- Step 7 - Verify the Metrics Endpoint
- Step 8 - A Working Example
- Conclusion
- Further Reading
Introduction
Observability is the ability to understand and measure the state of a system based on the data it generates. Observability is made up of metrics, traces, and logs. These three are often called the pillars of observability.
Observability is a key aspect of customer success metrics and is a must-have for any DevOps platform.
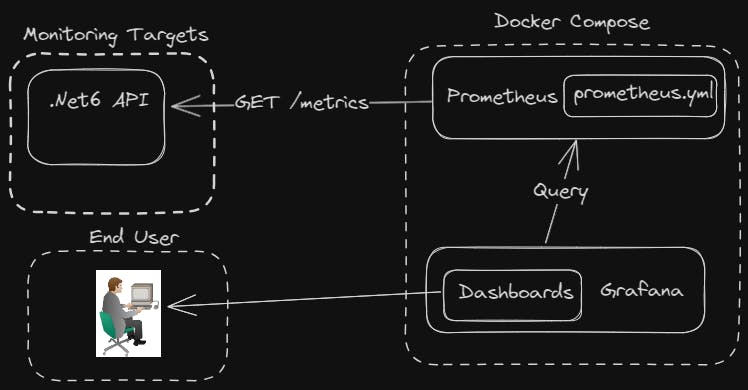
This article focuses on implementing Observability using the RED method. To achieve this, we will use Prometheus client instrumentation to extract metrics from a .Net6 API. Once the metrics are available, we will use Prometheus Query Language (PromQL) to build Grafana dashboards. Part two of this series will cover the design of the dashboards.
Audience
To complete this tutorial, you must have a basic understanding of Docker, REST APIs, and System Monitoring.
Prerequisites
To follow along, you will need the following:
.Net6 SDK and runtime installation on your local machine.
Postman installation on your local machine or any other REST client.
Clone the source code and troubleshooting guide here.
Docker installation on your local machine.
Once you have finished the setup, you can continue with this article.
Architecture
This is what we are going to build:
RED Metrics
The RED method states that for every resource, you should monitor:
Rate: the number of requests per second.
Errors: the number of requests that are failing.
Duration: the amount of time requests take.
Step 1 - Setup a .Net 6 WebAPI Project
To start, we need to spin up a .Net 6 WebAPI project using the .Net CLI. We choose the .Net 6 SDK because it is a Long Term Support (LTS) release. LTS releases are desirable because they have a longer support lifecycle, which means the code in this tutorial code will work for a reasonably extended period.
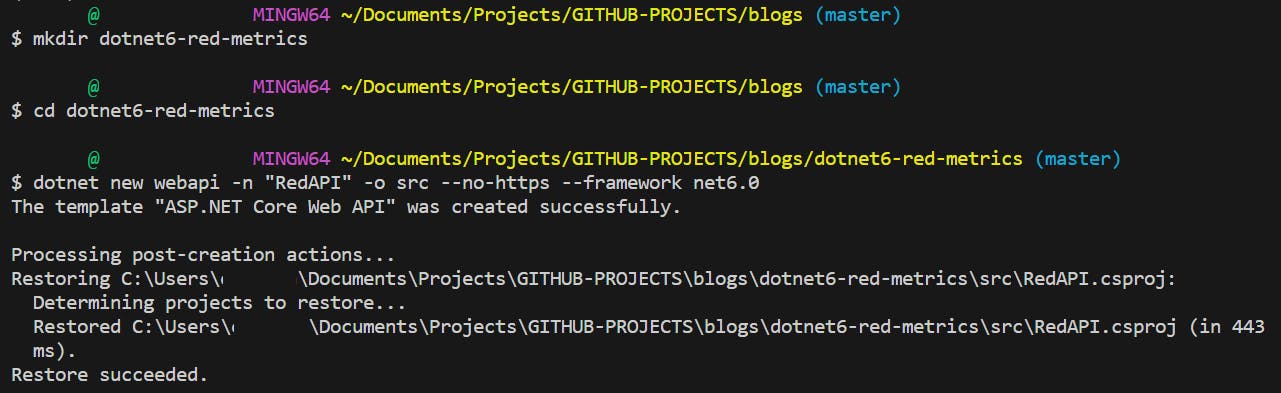
From your current working directory run the following .NET CLI commands:
mkdir dotnet6-red-metrics
cd dotnet6-red-metrics
dotnet new webapi -n "RedAPI" -o src --no-https --framework net6.0
The image below shows the final output on a Windows system:
What are we doing:
dotnet new webapi: This command instructs the .NET CLI to create a new project using the"webapi"template.-n "RedAPI": This option specifies the name of our project.-o src: This option specifies the output directory for our project. The directory is automatically created if it does not already exist.--no-https: The option--no-httpsdisables HTTPS in the generated project. By default, when you create a .Net WebAPI project it is configured to run on https. For simplicity, we configure our API to run on http.--framework net6.0: There are multiple .Net SDKs on this system so we pass the option--framework net6.0so that the generated project runs on .Net6 SDK.
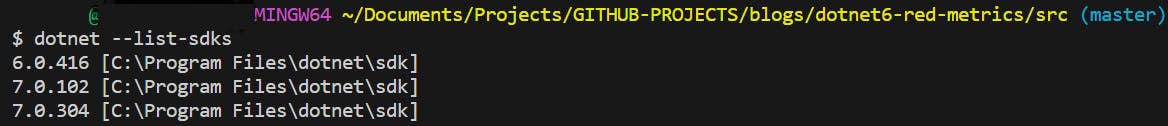
The --framework net6.0 option is not necessary if your system has only one version of .Net SDK installed. You can check installed .Net SDKs using the command dotnet --list-sdks. The output below shows that our system has three versions of .Net SDK installed:
Before we go any further, let's test if everything is working :
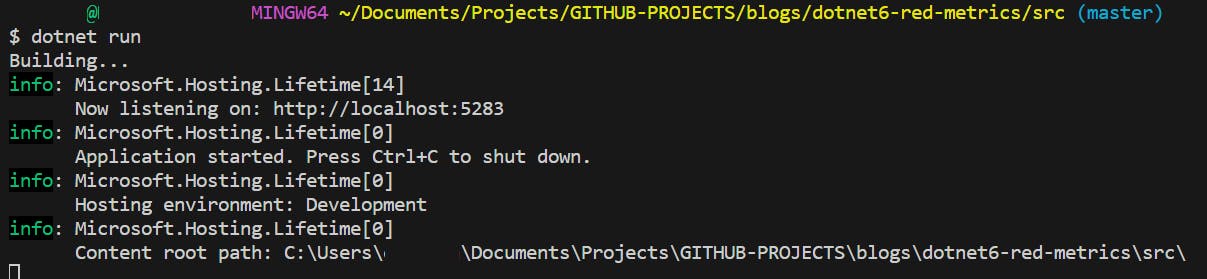
We use dotnet run to run the application and Ctrl + C to stop the application.
Next, we install the Prometheus-net library from Nuget. Prometheus-net is a .NET library that supports Prometheus metrics collection and sharing them on a specific endpoint. There are two things to consider when installing a dotnet package:
Install method: there are various ways of installing .Net packages, in this example, we use the .Net CLI.
Install path: packages are installed from the project root i.e. the path containing the
.csprojfile.
From the project root, we run the following commands:
dotnet add package prometheus-net --version 6.0.0
dotnet add package prometheus-net.AspNetCore --version 6.0.0
NOTE: The .NET CLI is included with the .NET SDK and you don't need to do a separate installation.
Step 2 - Create a Metrics Definitions Class
Next, we define a set of metrics that will enable us to implement the RED method:
using System;
using Microsoft.Extensions.Logging;
using Prometheus;

namespace SampleAPI.Metrics {

public class MetricReporter
{
    private readonly ILogger<MetricReporter> _logger;
    private readonly Counter _requestCounter;
    private readonly Histogram _responseTimeHistogram;

    public MetricReporter(ILogger<MetricReporter> logger)
    {
        _logger = logger ?? throw new ArgumentNullException(nameof(logger));

        _requestCounter = Metrics.CreateCounter("total_requests", "The total number of requests serviced by this API.");

        _responseTimeHistogram = Metrics.CreateHistogram("request_duration_seconds",
            "The duration in seconds between the response to a request.", new HistogramConfiguration
            {
                Buckets = new[] { 0.01, 0.025, 0.05, 0.1, 0.25, 0.5, 1, 2.5, 5, 10 },
                LabelNames = new[] { "status_code", "method" , "path"}
            });
    }

    public void RegisterRequest()
    {
        _requestCounter.Inc();
    }

    public void RegisterResponseTime(int statusCode, string method,string path, TimeSpan elapsed)
    {
        _responseTimeHistogram.Labels(statusCode.ToString(), method, path).Observe(elapsed.TotalSeconds);
    }
}
}
Let's go through this code:
Prometheus Metrics
The Prometheus monitoring system has four types of metrics. The choice of metric you will use depends on your specific use case. In cases where you need to measure rate, errors, and duration (RED), you should typically opt for a Histogram and Counter. We use the Prometheus-net package to record metrics. To invoke the package we use the line using Prometheus.
Counter
A counter is a Prometheus metric type whose value only goes up. To implement this, we utilize the Metrics.Counter(...) method, which allows us to initialize a counter metric named total_requests. This counter will use the .Inc() method to increment the request counter.
Histogram
To implement a Histogram, we utilize the Metrics.CreateHistogram(...) method. This method allows us to initialize a histogram metric named request_duration_seconds. This histogram will use the Observe method to track response times for all calls to our API. Together with the Counter, this setup is going to create a Histogram with the following time series:
The distribution of observations :
request_duration_seconds_bucketThe frequency of observations :
request_duration_seconds_countThe sum of observations :
request_duration_seconds_sum
Buckets
Histograms split measurements into intervals called buckets and count how many measurements fall into each. We opt for ten buckets, which, in effect represent the latency range of a typical API. The range goes from milliseconds to seconds. When selecting bucket ranges, it's always vital to pick a range that makes sense for the data and is meaningful for analysis.
Labels
The LabelNames property defines the labels for our histogram metric. A label, in the context of Prometheus, serves as an attribute of a metric, such as 'path, 'instance', 'job,' and more.
Prometheus can track multiple APIs simultaneously, each with its own request_duration_seconds metric. At any given time, how will Prometheus distinguish these multiple request_duration_seconds instances?
This is where the labels "status_code", "method", and "path" come into the picture. The Prometheus server will use labels, such as ""path", to differentiate APIs with the same request_duration_seconds metric.
Step 3 - Implement the Metrics Middleware
Next, we create a special middleware that works together with the Metrics Reporter class. This middleware collects and reports metrics related to incoming HTTP requests and responses.
using System;
using System.Diagnostics;
using System.Threading.Tasks;
using Microsoft.AspNetCore.Http;

namespace RedAPI.Middleware
{
    public class ResponseMetricMiddleware
    {
        private readonly RequestDelegate _request;
        public ResponseMetricMiddleware(RequestDelegate request)
        {
            _request = request ?? throw new ArgumentNullException(nameof(request));
        }
        public async Task Invoke(HttpContext httpContext, MetricReporter reporter)
        {
            var path = httpContext.Request.Path.Value;
            if (path == "/metrics")
            {
                await _request.Invoke(httpContext);
                return;
            }
            var sw = Stopwatch.StartNew();
            try
            {
                await _request.Invoke(httpContext);
            }
            finally
            {
                sw.Stop();
                reporter.RegisterRequest();
                reporter.RegisterResponseTime(httpContext.Response.StatusCode, httpContext.Request.Method, httpContext.Request.Path, sw.Elapsed);
            }
        }
    }
}
The middleware class's entry point is the Invoke method, which we call for each HTTP request. Inside this method the middleware checks if the request path is equal to "/metrics". If this is true, it skips the path and calls the next part in the request pipeline. This way, we ensure that the middleware doesn't include requests to "/metrics" in the data collected by Prometheus-net.
If the request is not intended for "/metrics", the middleware instantiates a Stopwatch to measure processing time. The middleware then calls the next part, which handles the request and generates the response. Once the response is returned, the Stopwatch stops and a MetricReporter instance records various metrics.
The MetricReporter is injected into the middleware in two ways:
RegisterRequest(): Increments counters for the total number of requests serviced.RegisterResponseTime(): Records the response time for the request based on the status code, HTTP method, and path.
Step 4- Register Metrics Reporter and Middleware
The Program.cs file is the entry point of a .Net6 API application. It is responsible for setting up services, middleware, and other components needed by the API. With this in mind, we need to register our metrics middleware within Program.cs. By registering this middleware, it becomes possible to monitor various metrics like error rates, CPU usage, and other custom metrics:
using Prometheus;
using RedAPI.Middleware;

var builder = WebApplication.CreateBuilder(args);

// Add services to the container.
builder.Services.AddControllers();
builder.Services.AddEndpointsApiExplorer();
builder.Services.AddSwaggerGen();
builder.Services.AddSingleton<MetricReporter>();
builder.Services.AddHttpClient();

var app = builder.Build();

// Add middleware to the request pipeline
if (app.Environment.IsDevelopment())
{
    app.UseSwagger();
    app.UseSwaggerUI();
    //place UseMetricServer() before app.MapControllers() to avoid losing some metrics
    app.UseMetricServer();
    app.UseMiddleware<ResponseMetricMiddleware>();
}
app.UseAuthorization();
app.MapControllers();
app.Run();
What are we doing :
builder.Services.AddSingleton<MetricReporter>(): This line registers aMetricReporteras a singleton service. A singleton makes available a singleinstance ofMetricReporterto other parts of the API.app.UseMetricServer(): This configures the Prometheus metrics endpoint, allowing us to collect metrics from the API.app.UseMiddleware<ResponseMetricMiddleware>(): This line registers our custom middleware, namedResponseMetricMiddleware.
Step 5 - Add a Custom "Problem" Method
In the RED method, the rate of errors is also an important aspect. To monitor errors in the API, we begin by creating a new controller called ForecastController. Additionally, for ease of testing and tracking, we define a method that always returns an HTTP 500 error :
using Microsoft.AspNetCore.Mvc;
using RedAPI.Models;

namespace RedAPI.Controllers
{
    [ApiController]
    [Route("api/[controller]")]
    public class ForecastController : ControllerBase
    {
        private readonly ILogger<ForecastController> _logger;

        public ForecastController(ILogger<ForecastController> logger)
        {
            _logger = logger;
        }

        [HttpPost("problem")]
        public IActionResult Problem([FromBody] WeatherForecast forecast)
        {
            //always returns HTTP 500 error
            return Problem();
        }
    }
}
The Problem method is an in-built function from .Net Core's ControllerBase class. It is designed to return an HTTP 500 response. We also add the default WeatherForecast model of the API to the Problem method. If you have cloned the source code you will notice this model at the path blogs\dotnet6-red-metrics\src\.
Let's execute a request and check if we get an HTTP 500 error:
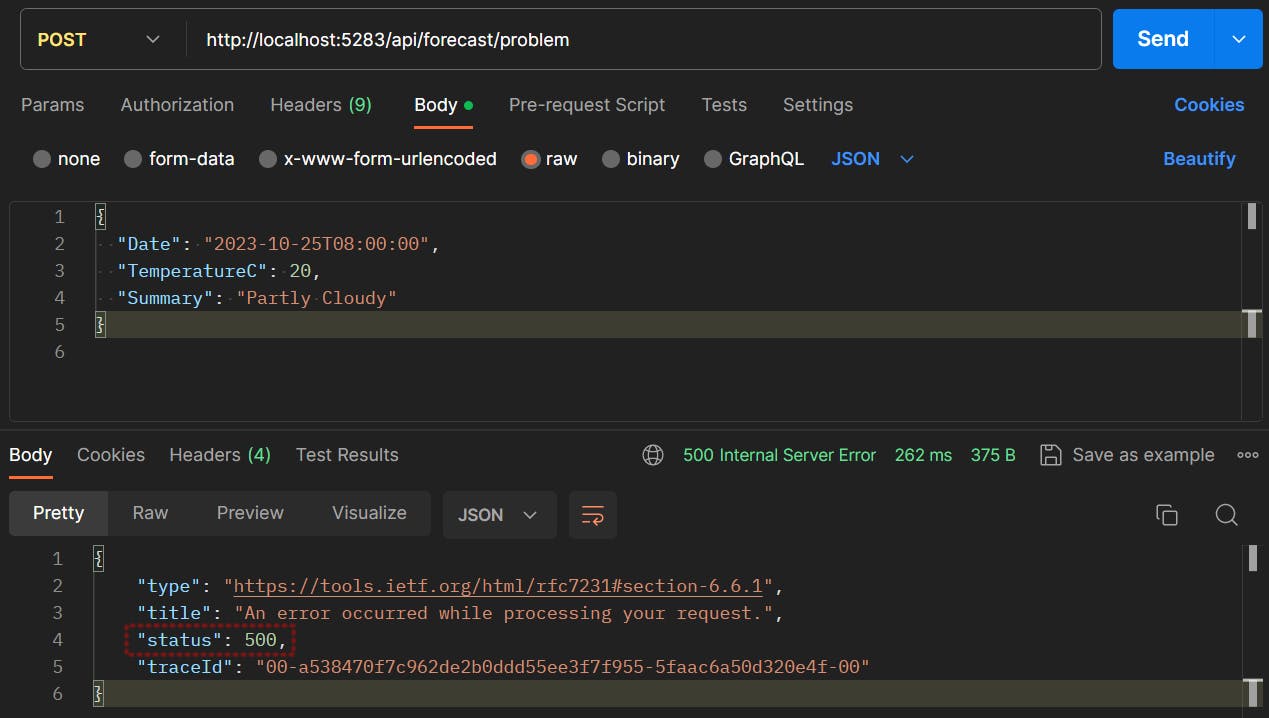
The request returns an HTTP 500 status code, confirming an error in the response execution.
Step 6 - Add a Long-Running Method
The RED method also requires tracking the request duration on a service. For convenience, we add a new method that will return the response with a 200 millisecond delay:
using Microsoft.AspNetCore.Mvc;
using RedAPI.Models;
using System.Net;

namespace RedAPI.Controllers
{
    [ApiController]
    [Route("api/[controller]")]
    public class ForecastController : ControllerBase
    {
        private readonly ILogger<ForecastController> _logger;
        private readonly HttpClient _httpClient;

        public ForecastController(ILogger<ForecastController> logger, IHttpClientFactory httpClientFactory)
        {
            _logger = logger;
            _httpClient = httpClientFactory.CreateClient();
            _httpClient.BaseAddress = new System.Uri("https://jsonplaceholder.typicode.com/");
        }

         [HttpPost("problem")]
        public IActionResult Problem([FromBody] WeatherForecast forecast)
        {
            //always returns HTTP 500 error
            return Problem();
        }

        [HttpGet]
        public async Task<ActionResult<string>> Get()
        {
            HttpResponseMessage response = await _httpClient.GetAsync("comments");

            if (response.IsSuccessStatusCode)
            {
                string comments = await response.Content.ReadAsStringAsync();
                System.Threading.Thread.Sleep(200);
                return Ok(comments);
            }
            else
            {
                return StatusCode((int)response.StatusCode);
            }
        }
    }
}
What are we doing :
ForecastController : ControllerBase: In ASP.NET Core, controllers handle incoming HTTP requests and define the application's endpoints.public UserController(...): The constructor of theForecastControllerclass takes two parameters: a logger and an HTTP client. The logger takes care of logging, whilst theIHttpClientFactoryis used to create anHttpClientinstance. TheHttpClientinstance will be used for making HTTP requests.Get(): This method sends an asynchronous GET request to the "comments" endpoint of the JSONPlaceholder API.Sleep(200): This method introduces a 200-millisecond delay in the request execution. We do this to ensure we generate requests with a sufficiently extended duration, which will be valuable for analysis when we review the RED dashboards.
Let's execute a request and check if the delay is working:
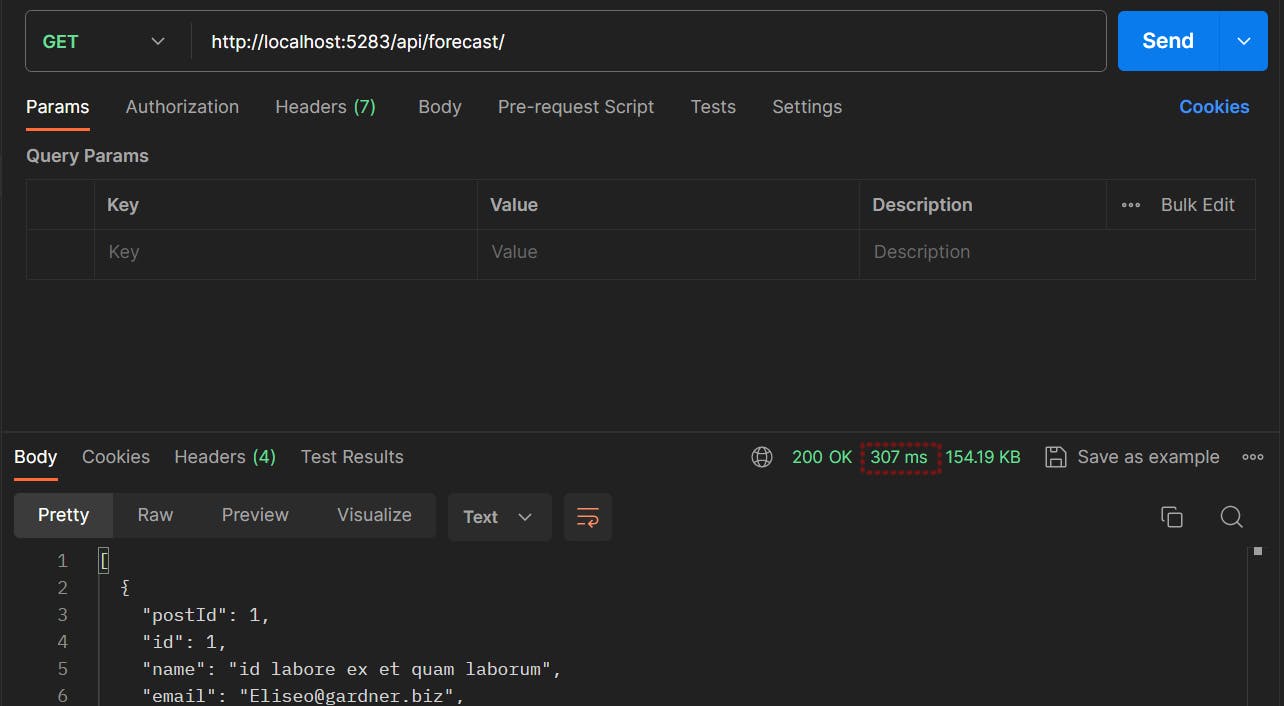
The request takes a total of 307 milliseconds, confirming a delay in the response execution.
Step 7 - Verify the Metrics Endpoint
To verify metrics generation we need to run the API and then execute requests to the API endpoints. If everything is working, Prometheus-net will expose the metrics at (http://localhost:5283/metrics), as demonstrated below:
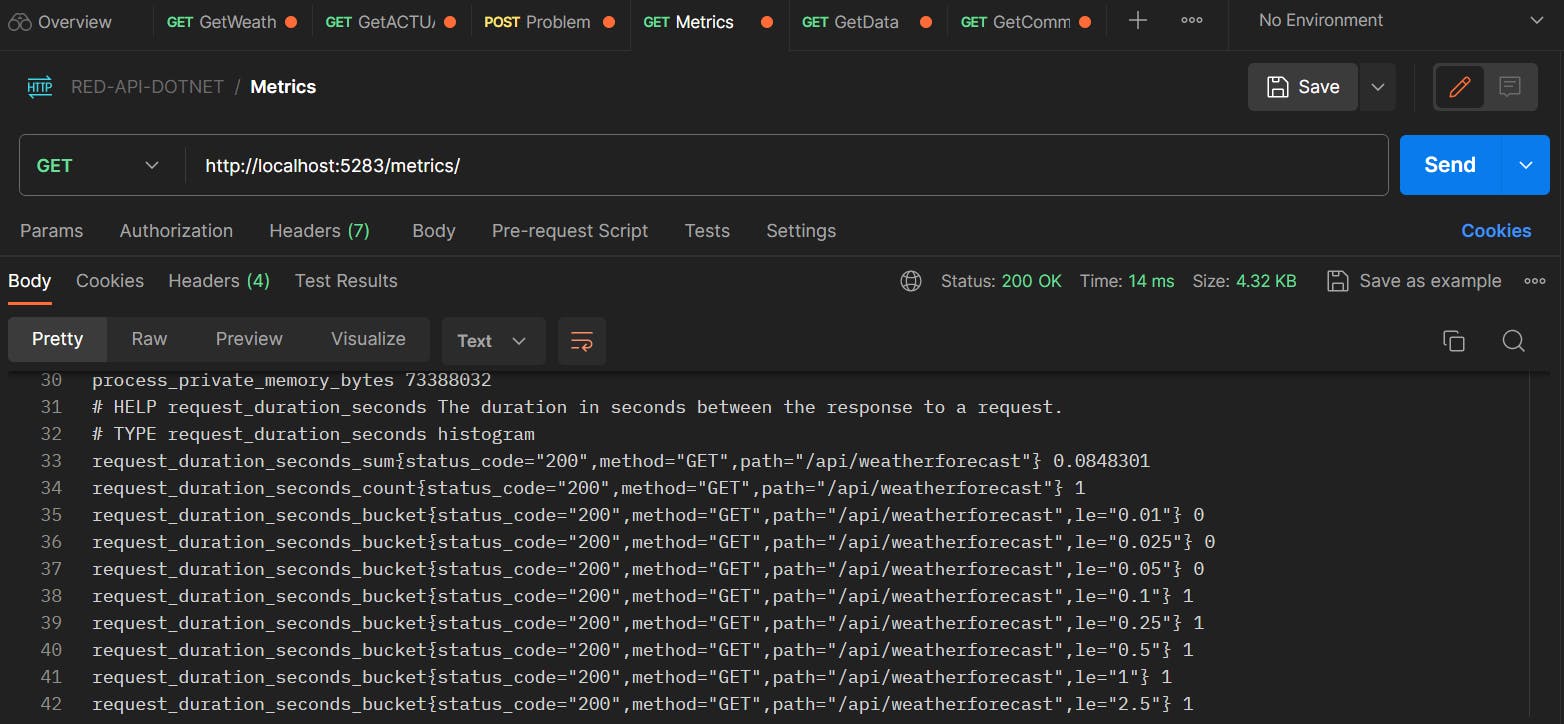
Let's go through this response:
request_duration_seconds_bucket{...}: This is a single time series and is represented by a combination of the metric name and key-value pairs.request_duration_seconds_bucket: This is the counter metric that we defined earlier in theMetricsReporterclass. Histogram buckets are exposed as counters using the metric name plus a _bucket suffix. The purpose of prepending the metric names with a "_bucket" suffix is to differentiate between the histogram itself and the cumulative counters associated with each bucket.le="0.01": This bucket contains the count of observations that were less than or equal to 0.01 seconds.request_duration_seconds_sum{...}: This is a single time series with the sum of the values of all measurements. The metric name is also prepended with a " _sum" suffix to differentiate it from the histogram itself.request_duration_seconds_count{...}: This is a single time series with the sum of all requests made to a particular endpoint. The metric name is also prepended with a " _sum" suffix to differentiate it from the histogram itself.
NOTE: The terms time series, bucket and metric are often used interchangeably.
Step 8 - A Working Example
Let's suppose the histogram has 3 requests that come in with durations 1s, 2s, and 3s. Then the metrics endpoint will return this dataset:
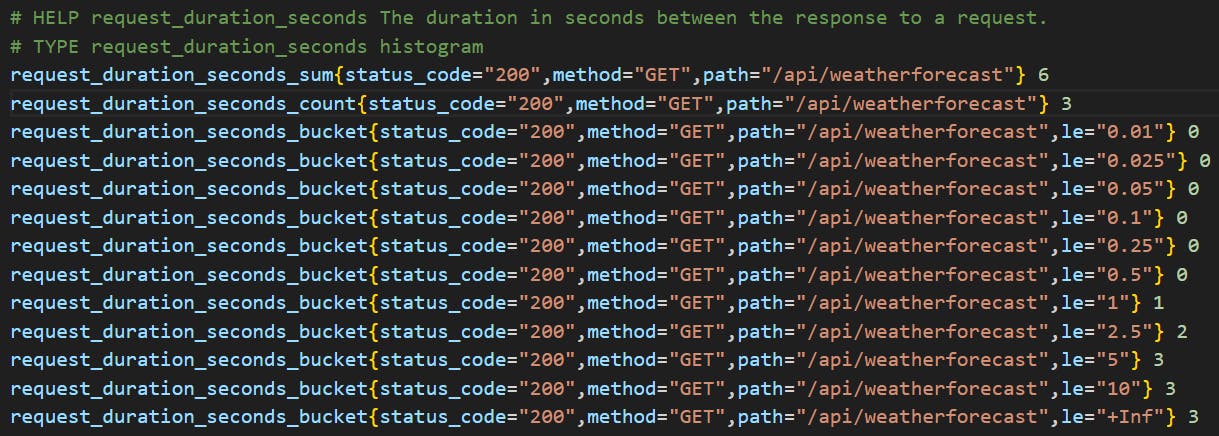
request_duration_seconds_sum is 1s + 2s + 3s = 6.
request_duration_seconds_count count is 3, because of 3 requests.
buckets falling in the range le="0.01" to le="0.5" have 0 because none of the requests fell in any of those buckets.
bucket le="1" is 1 because one of the requests was <= 1 seconds.
bucket le="2.5" is 2 because two of the requests were <= 2 seconds.
bucket le="5" is 3 because all of the requests were <= 3 seconds.
bucket le="10" is 3 because all of the requests were <= 3 seconds.
Conclusion
We have developed a .Net 6 API application that exposes Prometheus-style metrics, including a metric designed to track request durations. In the next post, we'll utilize this metric to create dashboards based on the RED method.
If you have a question or suggestion, please share in the comments.
If you liked this article follow me on Twitter for more DevOps, Cloud & SRE.
Further Reading
Prometheus Metrics, Labels and Time Series
Microservices Architecture With Client Instrumentation